This year the level of reported data by ICAO Member States presented in the Annual Report of the Council achieved the exceptional level of 97.7 per cent of global coverage. It is important to note that ICAO official statistics present the highest level of reporting coverage compared to any other source of global aviation data. It shows once again the trust the Member States have in official reporting and their confidence in ICAO data.
More details about ICAO aviation data and products:
https://data.icao.int/icads/
E-mail Contact:
cads@icao.int
According to ICAO’s preliminary compilation of annual global statistics, the total number of passengers carried on scheduled services increased to 3.3 billion in 2022, which is 42.8 per cent higher than the previous year, while with the number of departures increasing to 29.8 million in 2022, a 23.1 per cent increase. Detailed air transport statistics appear on the Presentation of 2022 Air Transport Statistical Results page.
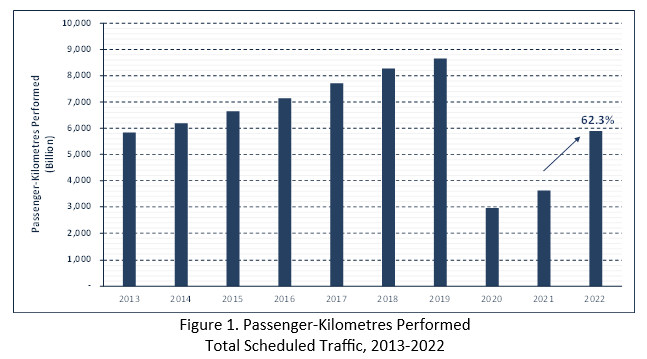
Passenger traffic (total scheduled revenue passenger-kilometres performed (RPKs))
Total increase: 62.3 per cent, equating to 5,889 billion RPKs
|
Change by region: | |
| Europe: | 30.0 per cent of world traffic, posting an increase of 92.1 per cent |
| Africa: | 2.2 per cent of world traffic, posting an increase of 83.3 per cent |
| Middle East: | 9.8 per cent of world traffic, posting an increase of 121.1 per cent |
| Asia and Pacific: | 22.4 per cent of world traffic, posting a decline of 34.4 per cent |
| North America: | 28.8 per cent of world traffic, posting an increase of 46.2 per cent |
| Latin America and Caribbean: | 6.8 per cent of world traffic, posting an increase of 70.4 per cent |
International scheduled passenger traffic
Total increase: 151.7 per cent in RPKs
|
Change by region: | |
| Europe: | 44.9 per cent of total RPK, posting an increase of 126.2 per cent |
| Africa: | 3.3 per cent of total RPK, posting an increase of 100.0 per cent
|
| Middle East: | 16.2 per cent of total RPK, posting an increase of 135.2 per cent |
| Asia and Pacific: | 15.2 per cent of total RPK, posting a decline of 452.4 per cent |
| North America: | 15.0 per cent of total RPK, posting an increase of 136.8 per cent |
| Latin America and Caribbean: | 5.4 per cent of total RPK, posting an increase of 138.0 per cent |
Domestic scheduled passenger traffic
Total increase: 9.8 per cent in RPKs
|
Change by region: | |
| Europe: | 10.0 per cent of total RPK, posting an increase of 0.7 per cent |
| Africa: | 0.8 per cent of total RPK, posting an increase of 25.8 per cent |
| Middle East: | 1.2 per cent of total RPK, posting an increase of 4.2 per cent |
| Asia and Pacific: | 32.0 per cent of total RPK, posting a decrease of -9.5 per cent |
| North America: | 47.3 per cent of total RPK, posting an increase of 25.6 per cent |
| Latin America and Caribbean: | 8.7 per cent of total RPK, posting an increase of 37.8 per cent |
Available seat-kilometres (ASK) capacity
Total increase: 40.4 per cent, passenger load factor of 78.3 per cent
|
Global share and load factor: | |
| Europe: | 29.0 per cent of total ASK, with passenger load factor of 81.0 per cent |
| Africa: | 2.4 per cent of total ASK, with passenger load factor of 71.5 per cent |
| Middle East: | 10.3 per cent of total ASK, with passenger load factor of 74.2 per cent |
| Asia and Pacific: | 24.5 per cent of total ASK, with passenger load factor of 71.4 per cent |
| North America: | 27.1 per cent of total ASK, with passenger load factor of 83.0 per cent |
| Latin America and Caribbean: | 6.6 per cent of total ASK, with passenger load factor of 81.0 per cent |
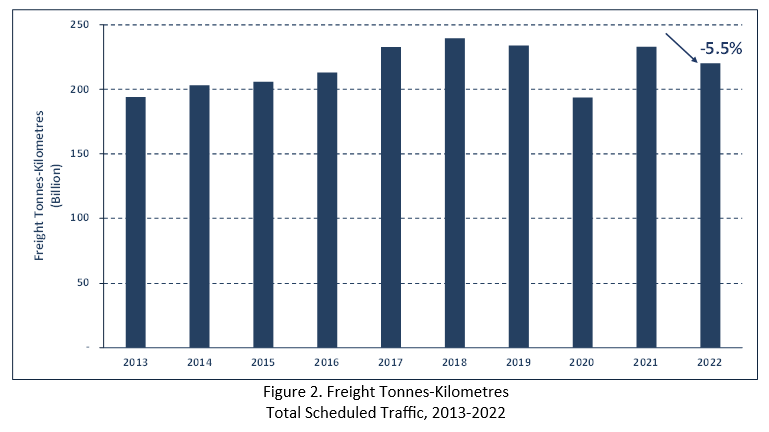
Freight traffic
Total millions of tonnes carried: 56.5 million
Decrease of scheduled total freight traffic, expressed in terms of scheduled total freight tonne-kilometres performed (FTKs): -5.5 per cent
Decrease of total scheduled
international freight traffic, expressed in terms of FTKs performed: -5.2 per cent
|
And by region – | |
| Europe: | 27.2 per cent of total FTKs performed, posting a decrease of -10.7 per cent |
| Africa: | 2.8 per cent of total FTKs performed, posting an increase of 8.4 per cent |
| Middle East: | 16.0 per cent of total FTKs performed, posting a decrease of -9.8 per cent |
| Asia and Pacific: | 35.2 per cent of total FTKs performed, posting a decrease of -4.3 per cent |
| North America: | 15.6 per cent of total FTKs performed, posting an increase of 1.5 per cent |
| Latin America and Caribbean: | 3.2 per cent of total FTKs performed, posting an increase of 23.4 per cent |
Scheduled international freight capacity in 2022, expressed in available freight tonne-kilometres, was approximately 359 billion, an increase of 13.1 per cent compared to 2021. The scheduled international freight load factor in 2022 decreased to 53.9 per cent.
Operating profit of scheduled airlines of Member States
Estimated at about a positive 1.7 per cent of operating revenues, operating profit is expected to be around USD 12.5 billion in 2022 based on operating revenues of USD 730.5 billion.
A detailed variance analysis of changes in operating profits appears in the Presentation of 2022 Air Transport Statistical Results, Table 9.
Long-term air traffic forecasts
The post-COVID long-term forecasts scenarios developed by the Secretariat and the Multi-Disciplinary Working Group on Long-term Traffic Forecasts revolve around three scenarios (low, mid and high). In the mid scenario, the passenger traffic expressed in revenue passenger-kilometers is expected to grow at 4.5 per cent annually in the next 20 years.
Aircraft
The world’s major manufacturers delivered 1,143 new commercial aircraft in 2022 and recorded 1,567 new aircraft net orders. Book-to-bill ratios for two of the largest aircraft manufacturers reached 1.37 in 2022 while in 2021 was 1.10.
(https://flightplan.forecastinternational.com/2023/01/16/airbus-and-boeing-report-december-and-full-year-2022-commercial-aircraft-orders-and-deliveries/)
Aviation safety
There were 64 aircraft accidents for scheduled commercial air transport operations in 2022, an increased from the 48 accidents reported by the Member States in 2021. This is according to an analysis of global accident data involving commercial air transport aircraft with a maximum certificated take-off mass of more than 5 700 kilograms. The number of fatalities in scheduled operations worldwide stood at 160, resulting from seven fatal accidents. The global accident rate was 2.05 accidents per million scheduled departures, versus 1.93 accidents per million scheduled departures in 2021.
Unlawful Interference
61 acts of unlawful interference were recorded. These included:
7 attacks on aircraft in flight
30 attacks on airports or other aviation facility
2 attacks using aircraft as a weapon
2 cyber-attacks endangering aviation safety
2 unlawful seizures of aircraft
and 18 other attacks.
Details concerning all 2022 events are available in the Acts of Unlawful Interference Database, which is accessible through ICAO’s secure website.
